
Steps
forum member
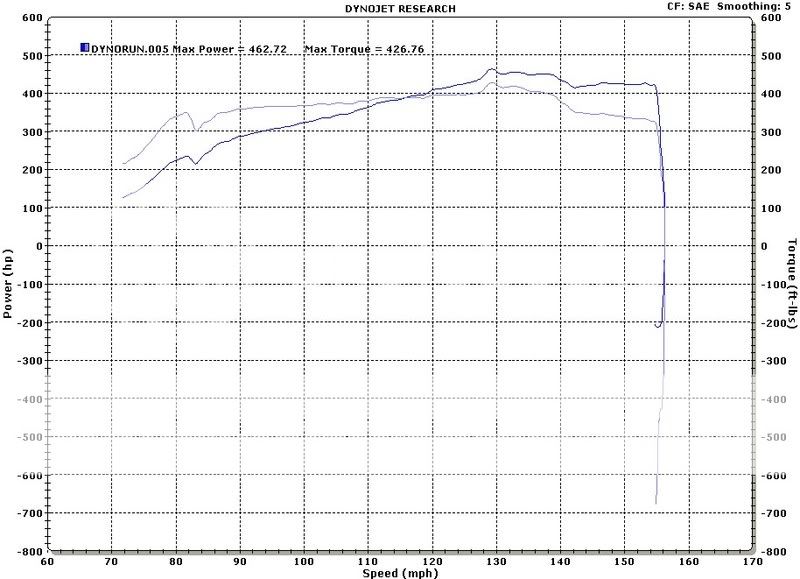
Here is the graph again.
I noticed if I show the graph with engine RPM I see the funky lines over 5k...if I use speed (MPH) the graph looks different. I know the print out Dyno-Pro gave me looked like this one....
I noticed if I show the graph with engine RPM I see the funky lines over 5k...if I use speed (MPH) the graph looks different. I know the print out Dyno-Pro gave me looked like this one....